Avia dashboard overview
A tour of every dashboard section: KPIs, demographics, heatmap, forecast, and daily table.
The Avia dashboard is your central view of store performance. It brings together foot traffic, sales, and operational data into a single screen.
Key metrics at a glance
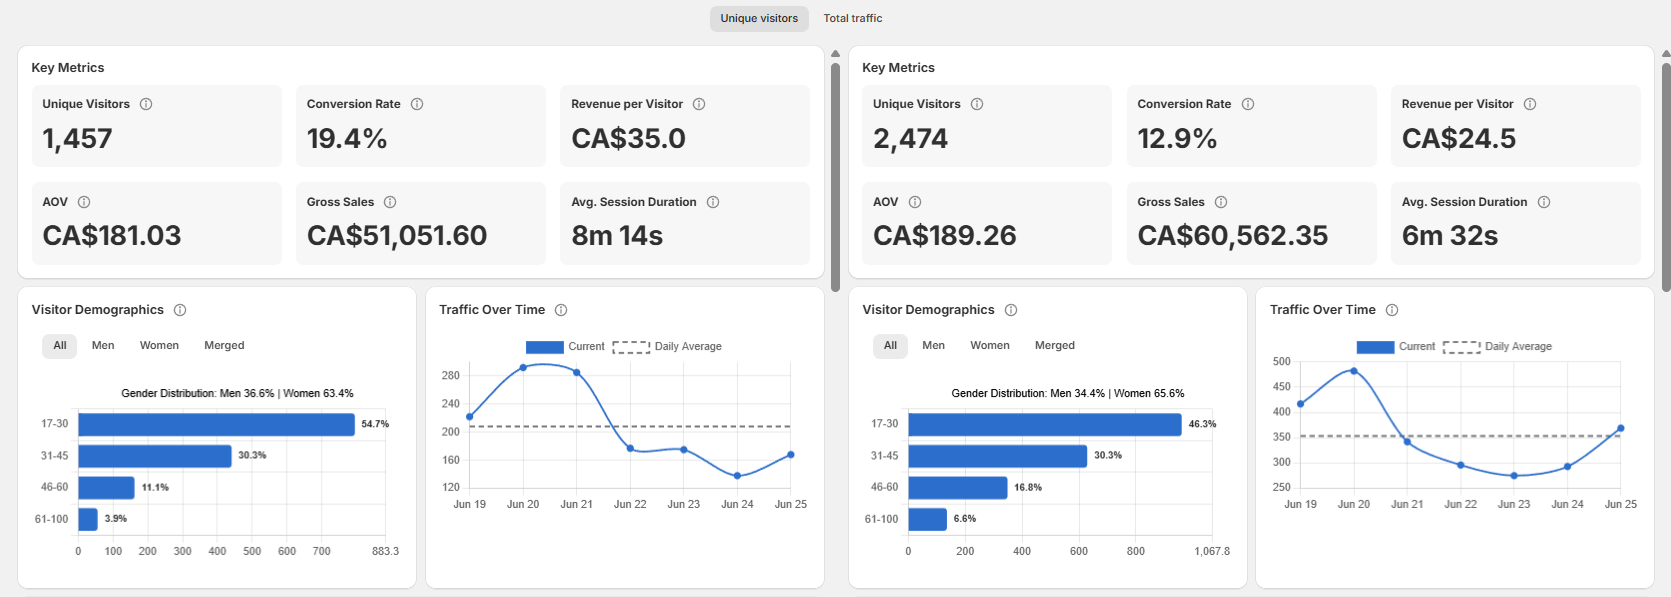
At the top of the dashboard you'll see your primary KPIs for the selected date range:
You can toggle between Unique Visitors and Total Traffic at the top. This switch updates all metrics across the entire dashboard.
Info: Why deduplication matters: a staff member who walks in and out 10 times counts as 1 unique visitor but 10 in total traffic. Unique Visitors gives you a true read on customer conversion and dwell time.

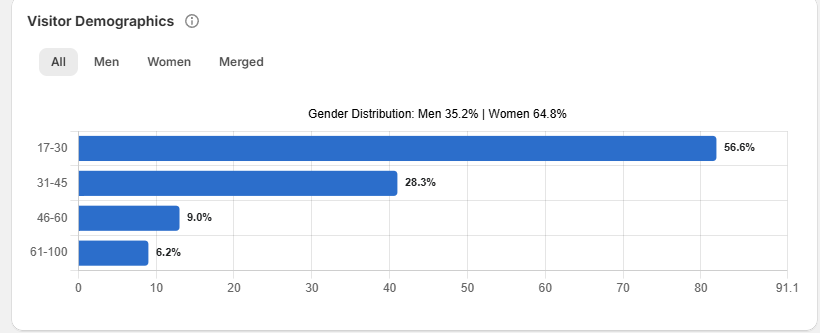
Visitor demographics
Below the KPIs, you'll see a breakdown of visitors by gender and age group. This updates based on your selected date range and filters.
Traffic heatmap
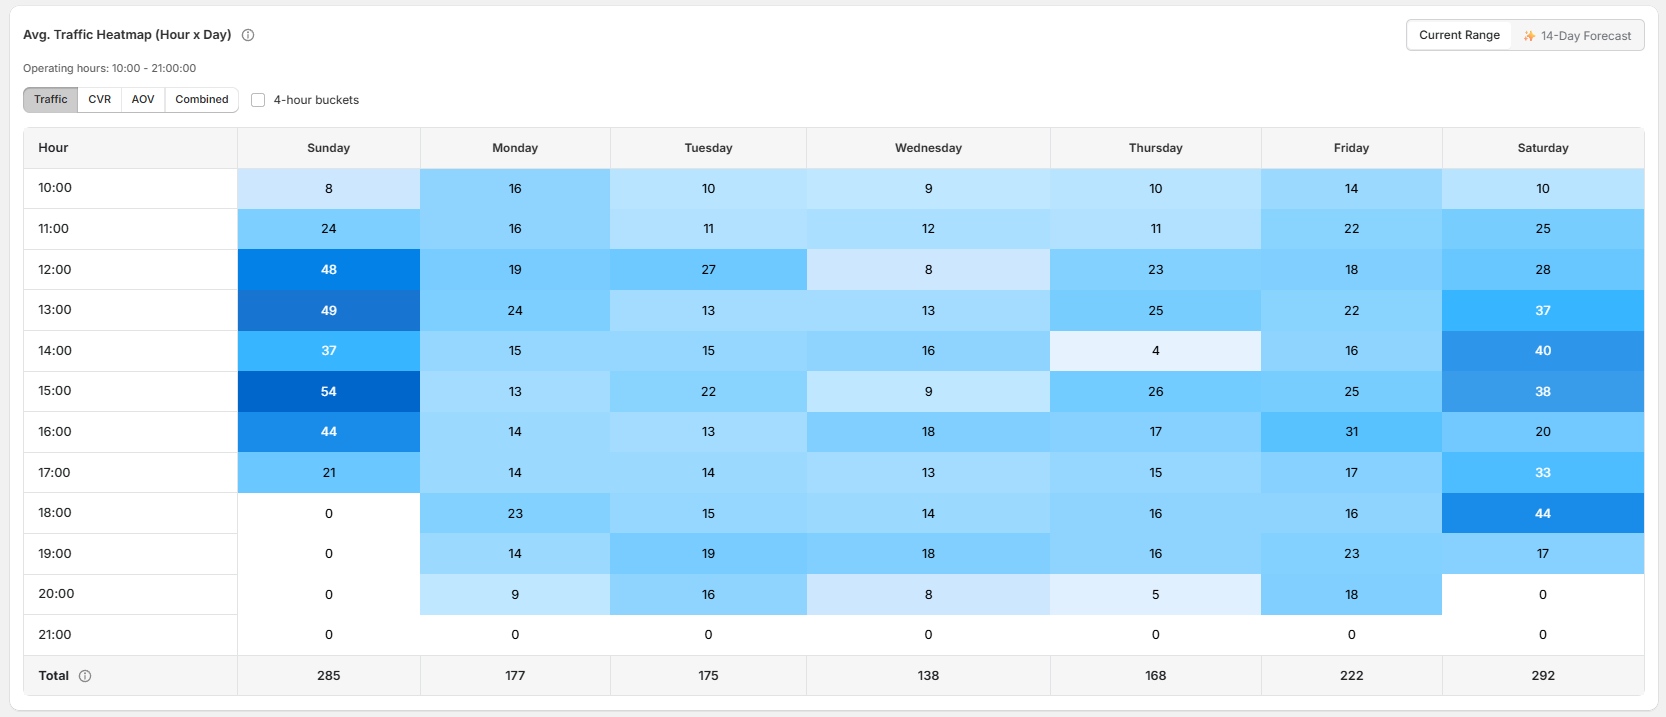
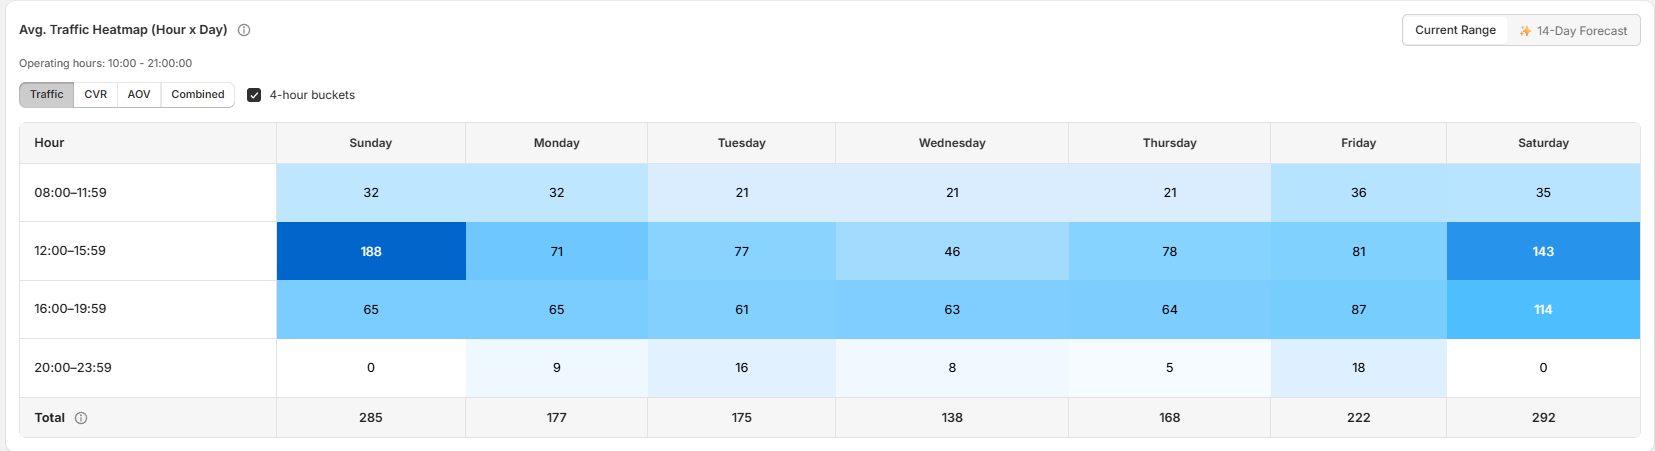
A grid showing visitor volume by hour of day and day of week. Switch between:
Hourly view: precise traffic by hour
4-hour bucket view: aligns with typical shift schedules (morning, afternoon, evening)
You can also switch the heatmap to show Conversion Rate or AOV by time slot, or a Combined View that overlays all three, useful for spotting high-traffic periods with low conversion, which often signals understaffing.
Traffic forecast
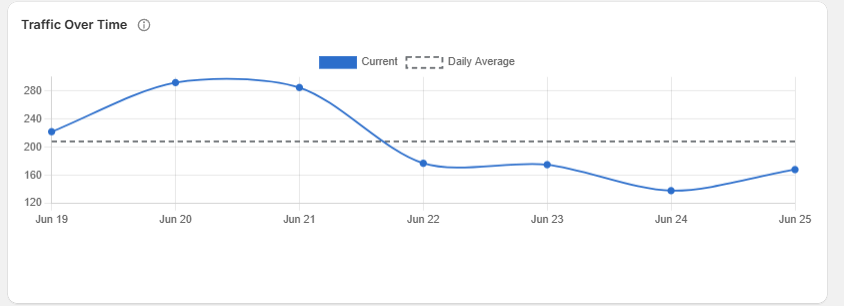
The 7-day forward forecast appears alongside the heatmap. It uses a linear regression model trained on your store's own history and requires at least 2 weeks of data to activate.
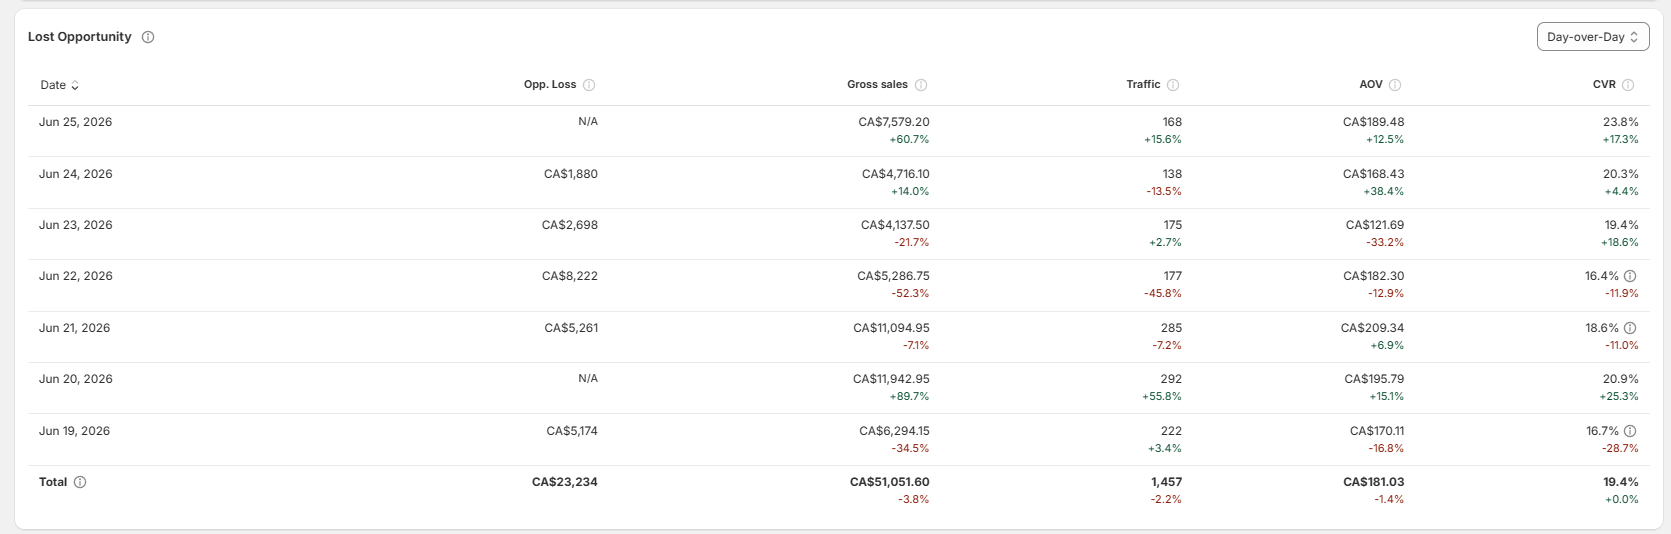
Daily performance table
At the bottom, a day-by-day breakdown using the sales decomposition formula: Sales = Traffic × Conversion Rate × AOV. Each row shows Gross Sales, Unique Visitors, Conversion Rate, and AOV for that day. When sales drop, this table tells you which lever changed: traffic, conversion, or basket size.
Store comparison
Click Compare to view two stores (or store groups) side by side across all metrics. Useful for benchmarking locations or regional groups.
Filters and date ranges
Use the date picker and store selector at the top to focus on a specific period or location. See Using date ranges & filters for full details.
Related articles
Need help?
If the dashboard data does not look correct after checking the selected store, date range, and store opening hours, contact Avia support at avia.support@retailogists.com and include:
Store name
Selected date range
A screenshot of the dashboard
Which metric or section looks incorrect