Conversion rate & dwell time
How Avia calculates conversion and session duration, and what moves each metric.
Conversion rate and dwell time are the two metrics that tell you what happened after visitors walked in: did they buy, and how long did they stay.
Conversion Rate
Conversion rate is the single most important metric in physical retail analytics. It answers: of everyone who came into your store, what percentage actually bought something?
Conversion Rate = Transactions ÷ Unique Visitors × 100
In the Avia dashboard, this is calculated using Unique Visitors (not Total Traffic) to give you an accurate, staff-corrected figure.

What affects conversion rate
Conversion rate is a function of in-store execution, things that store associates and managers can control:
Staffing levels: understaffed stores convert less. See Understanding Labor Efficiency.
Product availability: out-of-stock items lose sales. See stockout alerts in the dashboard.
Customer experience: service quality, store layout, product placement, promotions or campaigns
Info: This is why Avia lets you set conversion rate as a store target. Unlike traffic, which staff can't control, conversion rate is directly actionable.
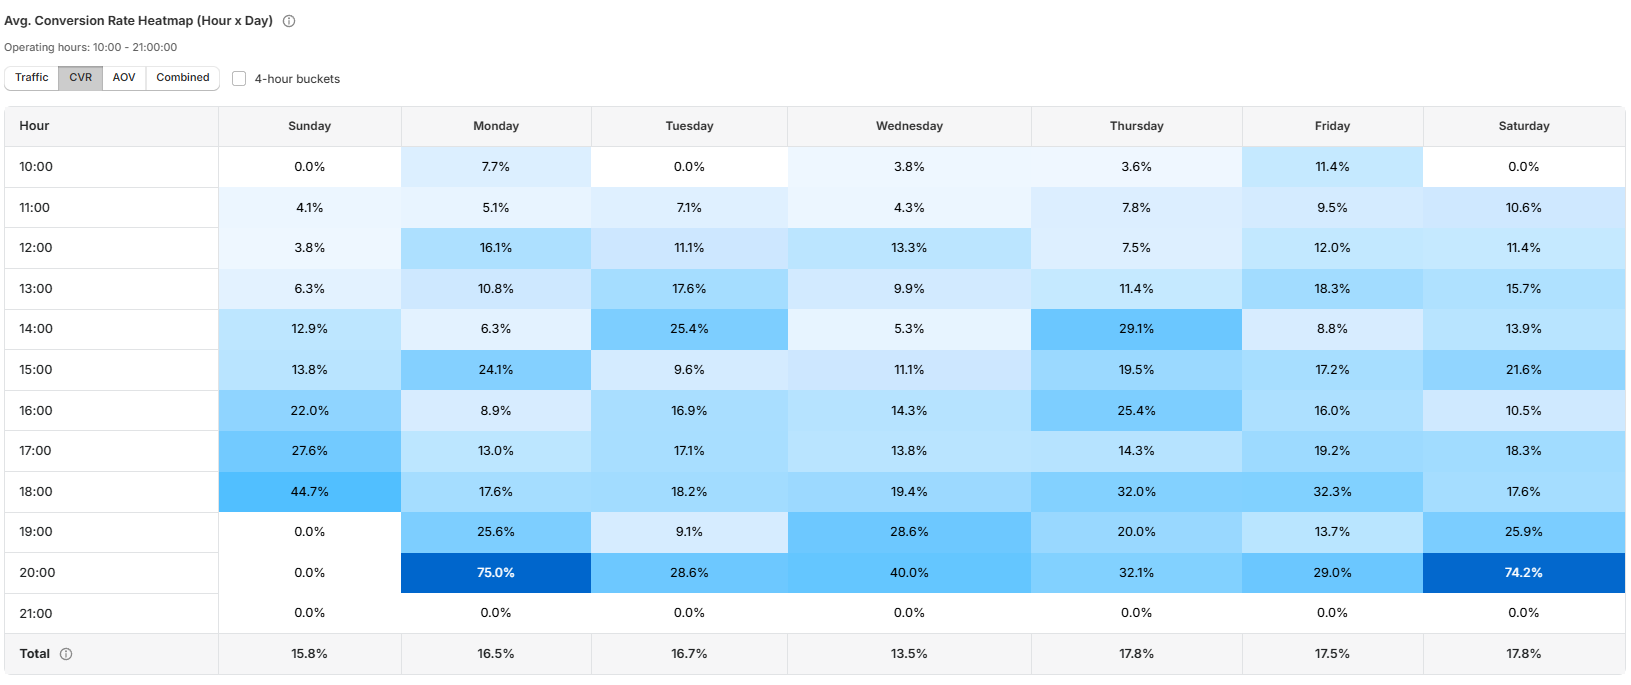
Conversion heatmap
The heatmap has a Conversion Rate view showing conversion by hour of day and day of week. This reveals patterns like high-traffic Saturday mornings that convert poorly, a common understaffing signal.
Average Session Duration (dwell time)
Average Session Duration measures how long visitors spend in the store, calculated from entry and exit timestamps.

Why it matters:
Longer dwell time generally correlates with higher conversion and AOV; visitors who spend more time in-store are more likely to buy
A sudden drop in dwell time can indicate a change in the customer experience (store layout change, product availability issue)
Dwell time broken down by demographic is on the Avia roadmap; the data structure already supports it
Where to find it
Average Session Duration is shown in the header metrics on the main dashboard. It reflects the average across all unique visitors for the selected date range and store.
Related articles
Need help?
If conversion rate or dwell time does not look correct after checking the selected store, date range, and Shopify connection, contact Avia support at avia.support@retailogists.com and include:
Store name
Selected date range
A screenshot of the dashboard
Whether Shopify sales data is appearing correctly